Modern undergraduate chemistry courses have an intensive coverage of spectroscopy. Most colleges and universities introduce students to IR and NMR in the organic chemistry course, while some coverage of UV/visible spectra is common even at the freshman level. Applications of UV/visible spectroscopy are customary in analytical chemistry classes. A more complete course in spectroscopy at the senior year level introduces students, among other topics, to some limited information about Raman spectroscopy [1]. Numerous educational Raman experiments were proposed for inorganic and physical chemistry classes [2-6]. Several new books [7-11] describe Raman spectroscopy and its analytical applications in detail.
Nevertheless, Raman spectroscopy gets far less attention than IR or UV/visible methods. It was suggested [4] that two of the major reasons for this are (a) the cost of the commercial instruments and (b) inaccessibility to a large database of standard Raman spectra for routine use. Recent developments in instrumentation have made these obstacles obsolete. The introduction of commercially available CCD detectors and laser diodes significantly reduced the price of dispersive Raman spectrophotometers [12]. For low-resolution instruments, this cost is now below that of an FTIR spectrometer. At the same time, numerous commercial databases have appeared in recent years, making automatic search a feasible option. However, the question of applicability of the instrument, which is affordable and simple but of low resolution, to traditional analytical problems remains open. What effect does low resolution have upon the performance of a Raman spectrometer? Several publications have addressed this question [3,12].
In this paper, a low resolution Raman instrument was used in several applications that appear in the analytical chemistry undergraduate program. We were trying to identify the Raman spectroscopy problems which are interesting from the point of view of the traditional analytical curriculum and are not affected significantly by lowering resolution. Among those general problems are: a) identification of a pure chemical compound or a major component of the mixture; b) identification of several components in a multicomponent mixture; c) quantitative determination of a single component; and d) quantitative analysis of the mixture of 3-4 compounds.
1. Experimental
We have used an R-2001 spectrometer (Raman Systems Inc., http://www.ramansystems.com/) which includes a diode laser of 500 mW power at 785 nm and S2000 fiber optics spectrophotometer having a working range of ~200-2700 cm-1. A simple cuvette compartment which fits a standard quartz (or glass) cuvette of 1 cm width was employed. A 1 mL sample was necessary for the measurement. After collection, the spectra were processed using the ACD/UV-IR Processor software package (ACD Labs Inc., http://www.acdlabs.com/). The resulting spectra can be viewed using a free SpecViewer from the same company.
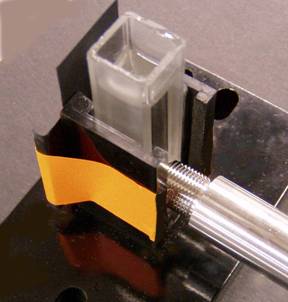
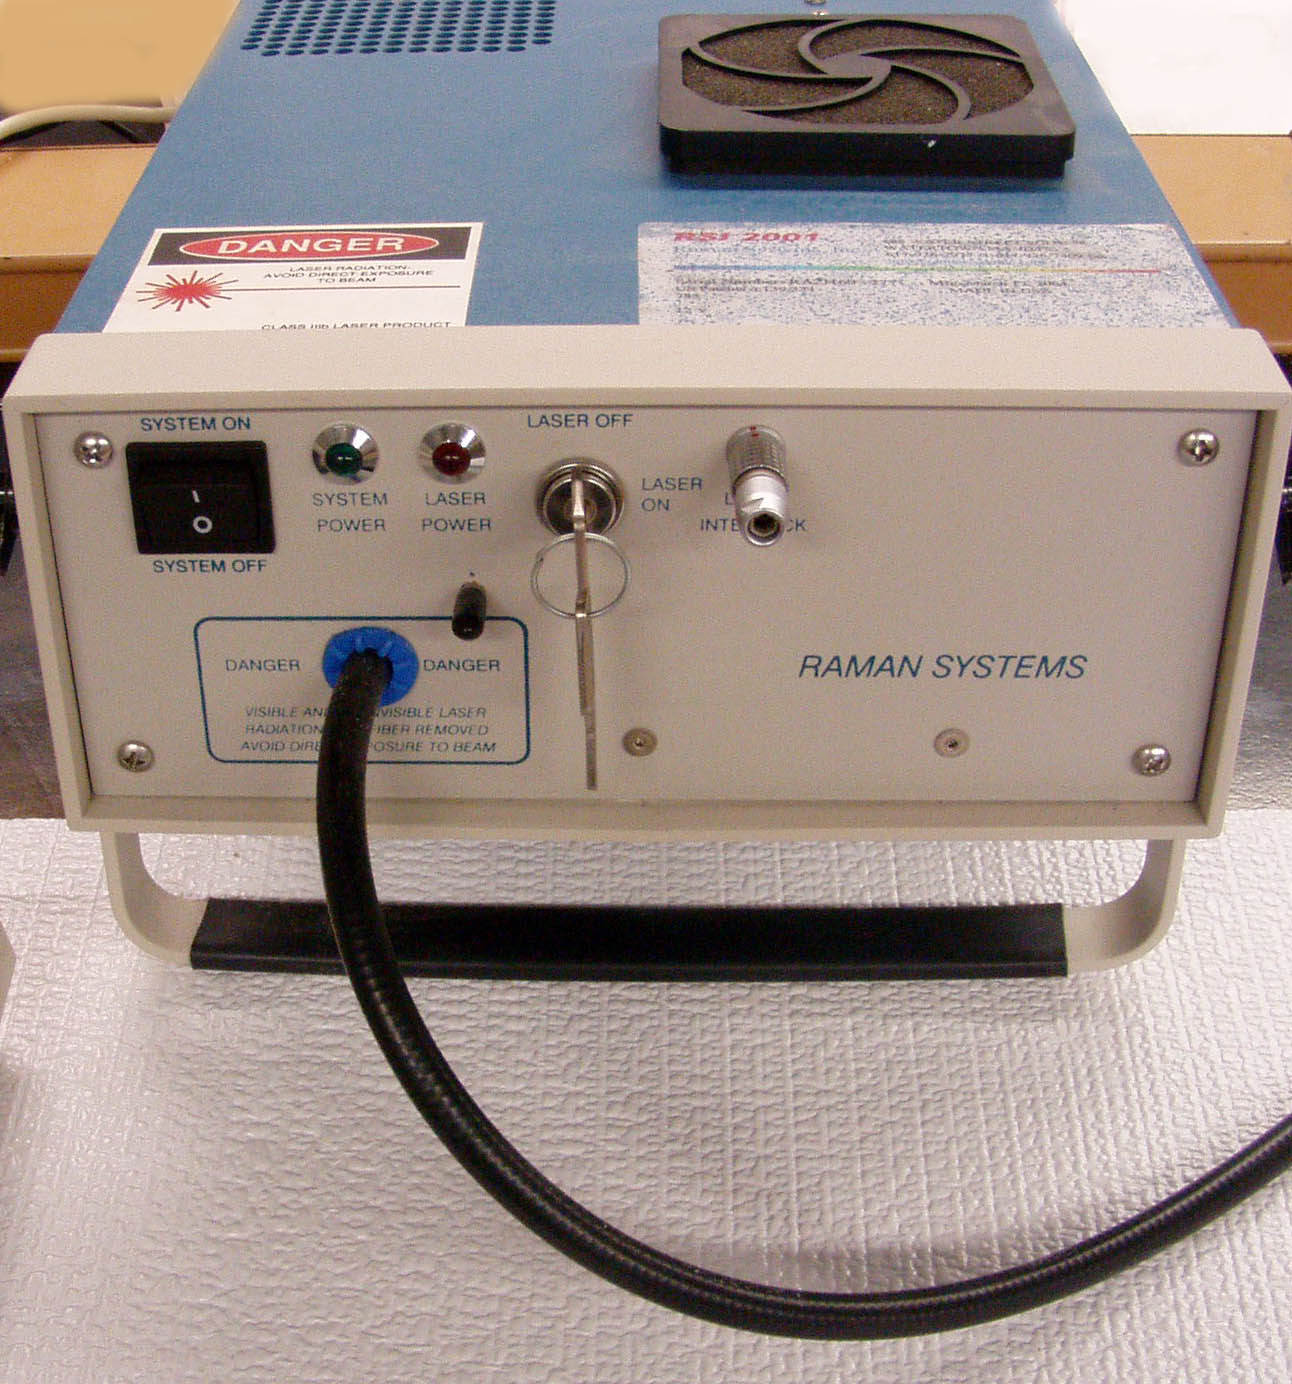 Figure 1.
The instrumental setup: a) a cuvette compartment (cover is removed); b) Raman 2001 spectrophotometer