2. Quantitative measurements of protonation reactions in solutions
Most of the general and analytical chemistry textbooks dedicate significant attention to acid-base equilibria in solutions of sulfuric, nitric, perchloric, carbonic, phosphoric and acetic acids. It is obvious that no changes are visible in the solution in all mentioned circumstances (with a limited exception of CO2 release from carbonate solutions of relatively high concentration). Students are expected to “believe” the instructor that the protonation or deprotonation occurs at some particular pH value; to have any visible effect, one should add an indicator. Raman spectra provide the necessary visualization of protonation phenomena. The addition or removal of a hydrogen atom from the oxoanion results in an easily seen alteration in the Raman spectrum due to the difference in symmetry and properties of a vibrating moiety. Such change is significant enough to be detected with a low-resolution instrument.
2.1 Spectra of acids.
Raman spectra of solutions of acids are different from the anion spectra clearly demonstrating the very existence of the protonation phenomenon at high acidity: if you see a different spectrum, it is almost certain that you are dealing with a different molecule. An example of Raman spectra of nitric acid solutions is shown in the most recent (2005) edition of Chemical Analysis by Harris [15]. Such demonstration is very simple: you prepare solutions of an acid and a conjugate base (that is, the corresponding anion), measure Raman spectra, and compare them. The difference between protonated and deprotonated forms is significant enough to be viewed with the low resolution spectrometer.
Figure 2. Low resolution Raman spectra of 60% perchloric(a) and nitric (b) acids. Spectra of nitrate and perchlorate ions are shown in color for comparison. Full-size figures are available by clicking at appropriate image.
Perchloric acid is an important exception; it shows the same Raman spectrum in 60% HClO4 solution as in NaClO4 solution. Protonation processes in sulfuric, nitric and phosphoric acids occur at high concentrations which require complex modeling in order to quantitatively describe the equilibria in solution and changes in the appropriate Raman spectra. In contrast to that, the protonation of CH3COO-, HPO42- and CO32- ions occur at mild acidity, where reliable measurements of pH are possible. These systems provide a convenient model for Raman determination of an appropriate protonation constant (Figure3).
2.2. “Raman titration” experiment.
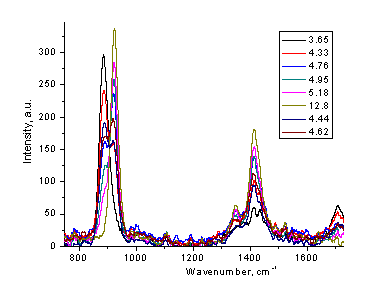
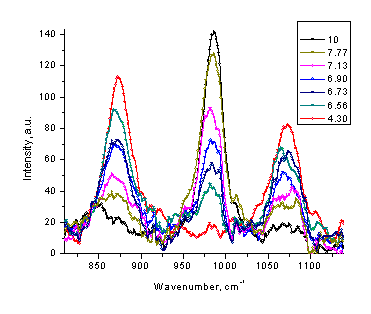
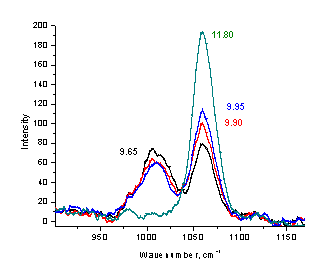
In all three cases (see Figure 4), the separation of Raman peaks of Broensted acid and its conjugated base is large enough to enable their separate measurement. As a result, one can measure acid and base concentrations simultaneously.
Experimental procedure:
- Prepare solutions of the Broensted acid (HCO3-, CH3COOH, H2PO4-) and its conjugate base (CO32-, CH3COO, HPO42-). Suitable concentrations of these solutions depend on the sensitivity of the particular Raman instrument; 0.2 mol/L solutions were appropriate in our experimental setup.
- Measure spectra and determine the intensities of the most prominent peaks for acidic and basic forms. Take 10 mL of the acidic form for the future “titration”.
- Add 2-3 drops of concentrated (50% ) NaOH. Measure the Raman spectrum (20-40s, single scan) and pH value of the resulting solution. Continue with step (3) until practically all of the acidic form has converted into its conjugated base.
- Data processing: From all the spectra measured, subtract the “blank” Raman spectrum of water. Using spectra of pure acidic and basic forms as the standards, calculate concentrations of the corresponding forms in each of the measured solutions . Determine the [base]/[acid] ratio at each point. When the NaOH is added, total concentration [base]+[acid] slightly decreases because of dilution, but the resulting ratio [base]/[acid] is not affected by this decrease. While the calculated concentrations may fluctuate a little because of the deviations in experimental conditions from one measurement to the next, the ratio is a far more stable value due to internal normalization.
- Plot the log([base]/[acid]) vs pH and calculate the apparent pKa value (Figure 3). If desired, the correction on ionic strength can be applied.
Figure 3. Determination of apparent dissociation constant of acetic acid (black), dihydrogen phosphate (green) and hydrogen carbonate (blue) using low resolution Raman data.
It is worth mentioning that two of the systems studied (HCO3- / CO32- and H2PO4- / HPO42-) are actually the standard buffers used for pH meter calibration [15].
Figure 4. Low resolution Raman spectra of phosphate (a), acetate (b), and carbonate (c) solutions at different pH values (20-40 s, single scan mode).
The same procedure can also serve as a foundation for a non-intrusive method of measuring the pH value of the corresponding buffer solution. By measuring the Raman spectrum of phosphate, acetate, or carbonate solution, one can estimate the pH value of this sample without insertion of any device or addition the indicator. The appropriate ranges for pH measurements are 3.8-5.3 for acetate, 6-8 for phosphate, and 9-10.5 for carbonate buffers. Formate buffer is another possible candidate for Raman measurements in the pH range of 3 - 4.


